Video Library
Browse helpful videos on Editorial Manager and ProduXion Manager


EAR: Calculating Turnaround Times
Via EM’s reporting module, publishers can track the number of days that elapse between key workflow events (calculate turnaround times), which can help them evaluate their success, and identify areas for improvement.

EAR: Reporting Across Data Sources Using Joins – Filtering Results
Publications can use Joins to report across multiple data sources from the dozens of tables and views available within EAR. Joins reports can be filtered to further narrow the output of displayed data.
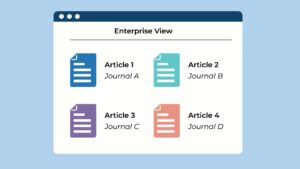
EAR: Calculating Volume of Submissions per Year
Editorial offices often want to compare current year with prior year data. For example, they may want to see the number of submissions, by article type, for this year compared with last year.
Evidence-Based Editorial Decisions with Impact Vizor
Data within EM can be extracted and submitted to HighWire’s Impact Vizor, which helps publishers make evidence-based decisions using citation monitoring and analysis of rejected and accepted manuscripts.
EAR: Calculating Acceptance Rates per Year
Editorial offices often want to explore acceptance rates, by article type, and across time. For example, they may want to see the acceptance rate, by article type, for this year compared with last year.

EAR: Identifying Author Geographical Origins
Via EM’s reporting module, publications can review key geographic diversity data by running a report on the geographic distribution of Authors or corresponding Authors for accepted manuscripts.
EAR: Calculating Time from Submission to Final Decision
Editorial offices often want to explore date driven metrics to gauge workflow performance. For example, they may want to see, for externally reviewed papers, how much time the workflow takes from submission to final decision.
EAR: Using Sub-Reports to Provide Additional Detail
Publications can pull additional information about a particular record by “drilling down” as the system performs a sub-query by “sending” the field’s value to an optionally accessible sub-report. Ideal for occasional use.
EAR: Calculating Time from Submission to First Decision
To gauge workflow performance, publications can pull date-driven data in EM. For example, how much time the workflow takes from submission to first decision for externally reviewed and non-externally reviewed papers.
EAR: Using Pivot Tables to Display Data
Pivot tables in EM’s reporting module are a flexible way for publishers to summarize, analyze, explore, and present patterns of data. When a pivot is created on a given field, it will create a new column for each unique value found within that field selected.
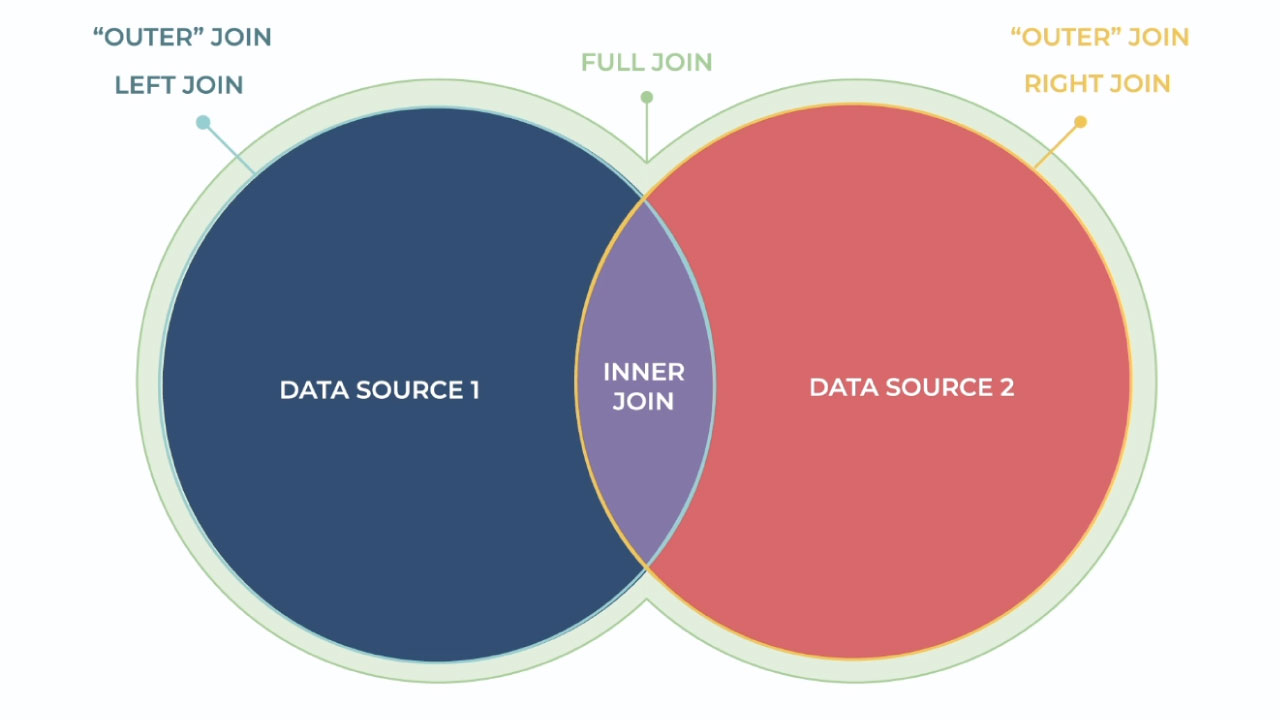
EAR: Reporting Across Data Sources Using Joins
There are dozens of tables and views in EM’s reporting module. Using Joins, publications can pull a report with information across two or more data sources.